Data Analysis
Module Introduction
On this page, you can perform the following types of tasks through conversation:
Data Analysis
- Data Cleaning: Handling missing values, removing duplicates, converting data types, formatting data, etc.
- Data Interpretation: Descriptive statistics, trend identification, comparative and difference analysis, anomaly and outlier detection, association analysis, prediction and inference, etc.
- Data Visualization: Bar charts, line charts, pie charts, scatter plots, heatmaps, box plots, etc.
- Data Modeling: Regression models, classification models, clustering models, time series models, etc.
- Trend Forecasting: Time series analysis, regression analysis, seasonal decomposition, smoothing methods, etc.
Document Comprehension
- Document Summary: Generate a summary of the uploaded document to quickly grasp its main content.
- Key Point Extraction: Extract key points or information from text or documents.
- Content Q&A: Answer questions based on the content of uploaded files, enabling intelligent Q&A with your documents.
You can also learn more about the features and usage of Data Analysis through the various function entry points on the page.
Feature Introduction
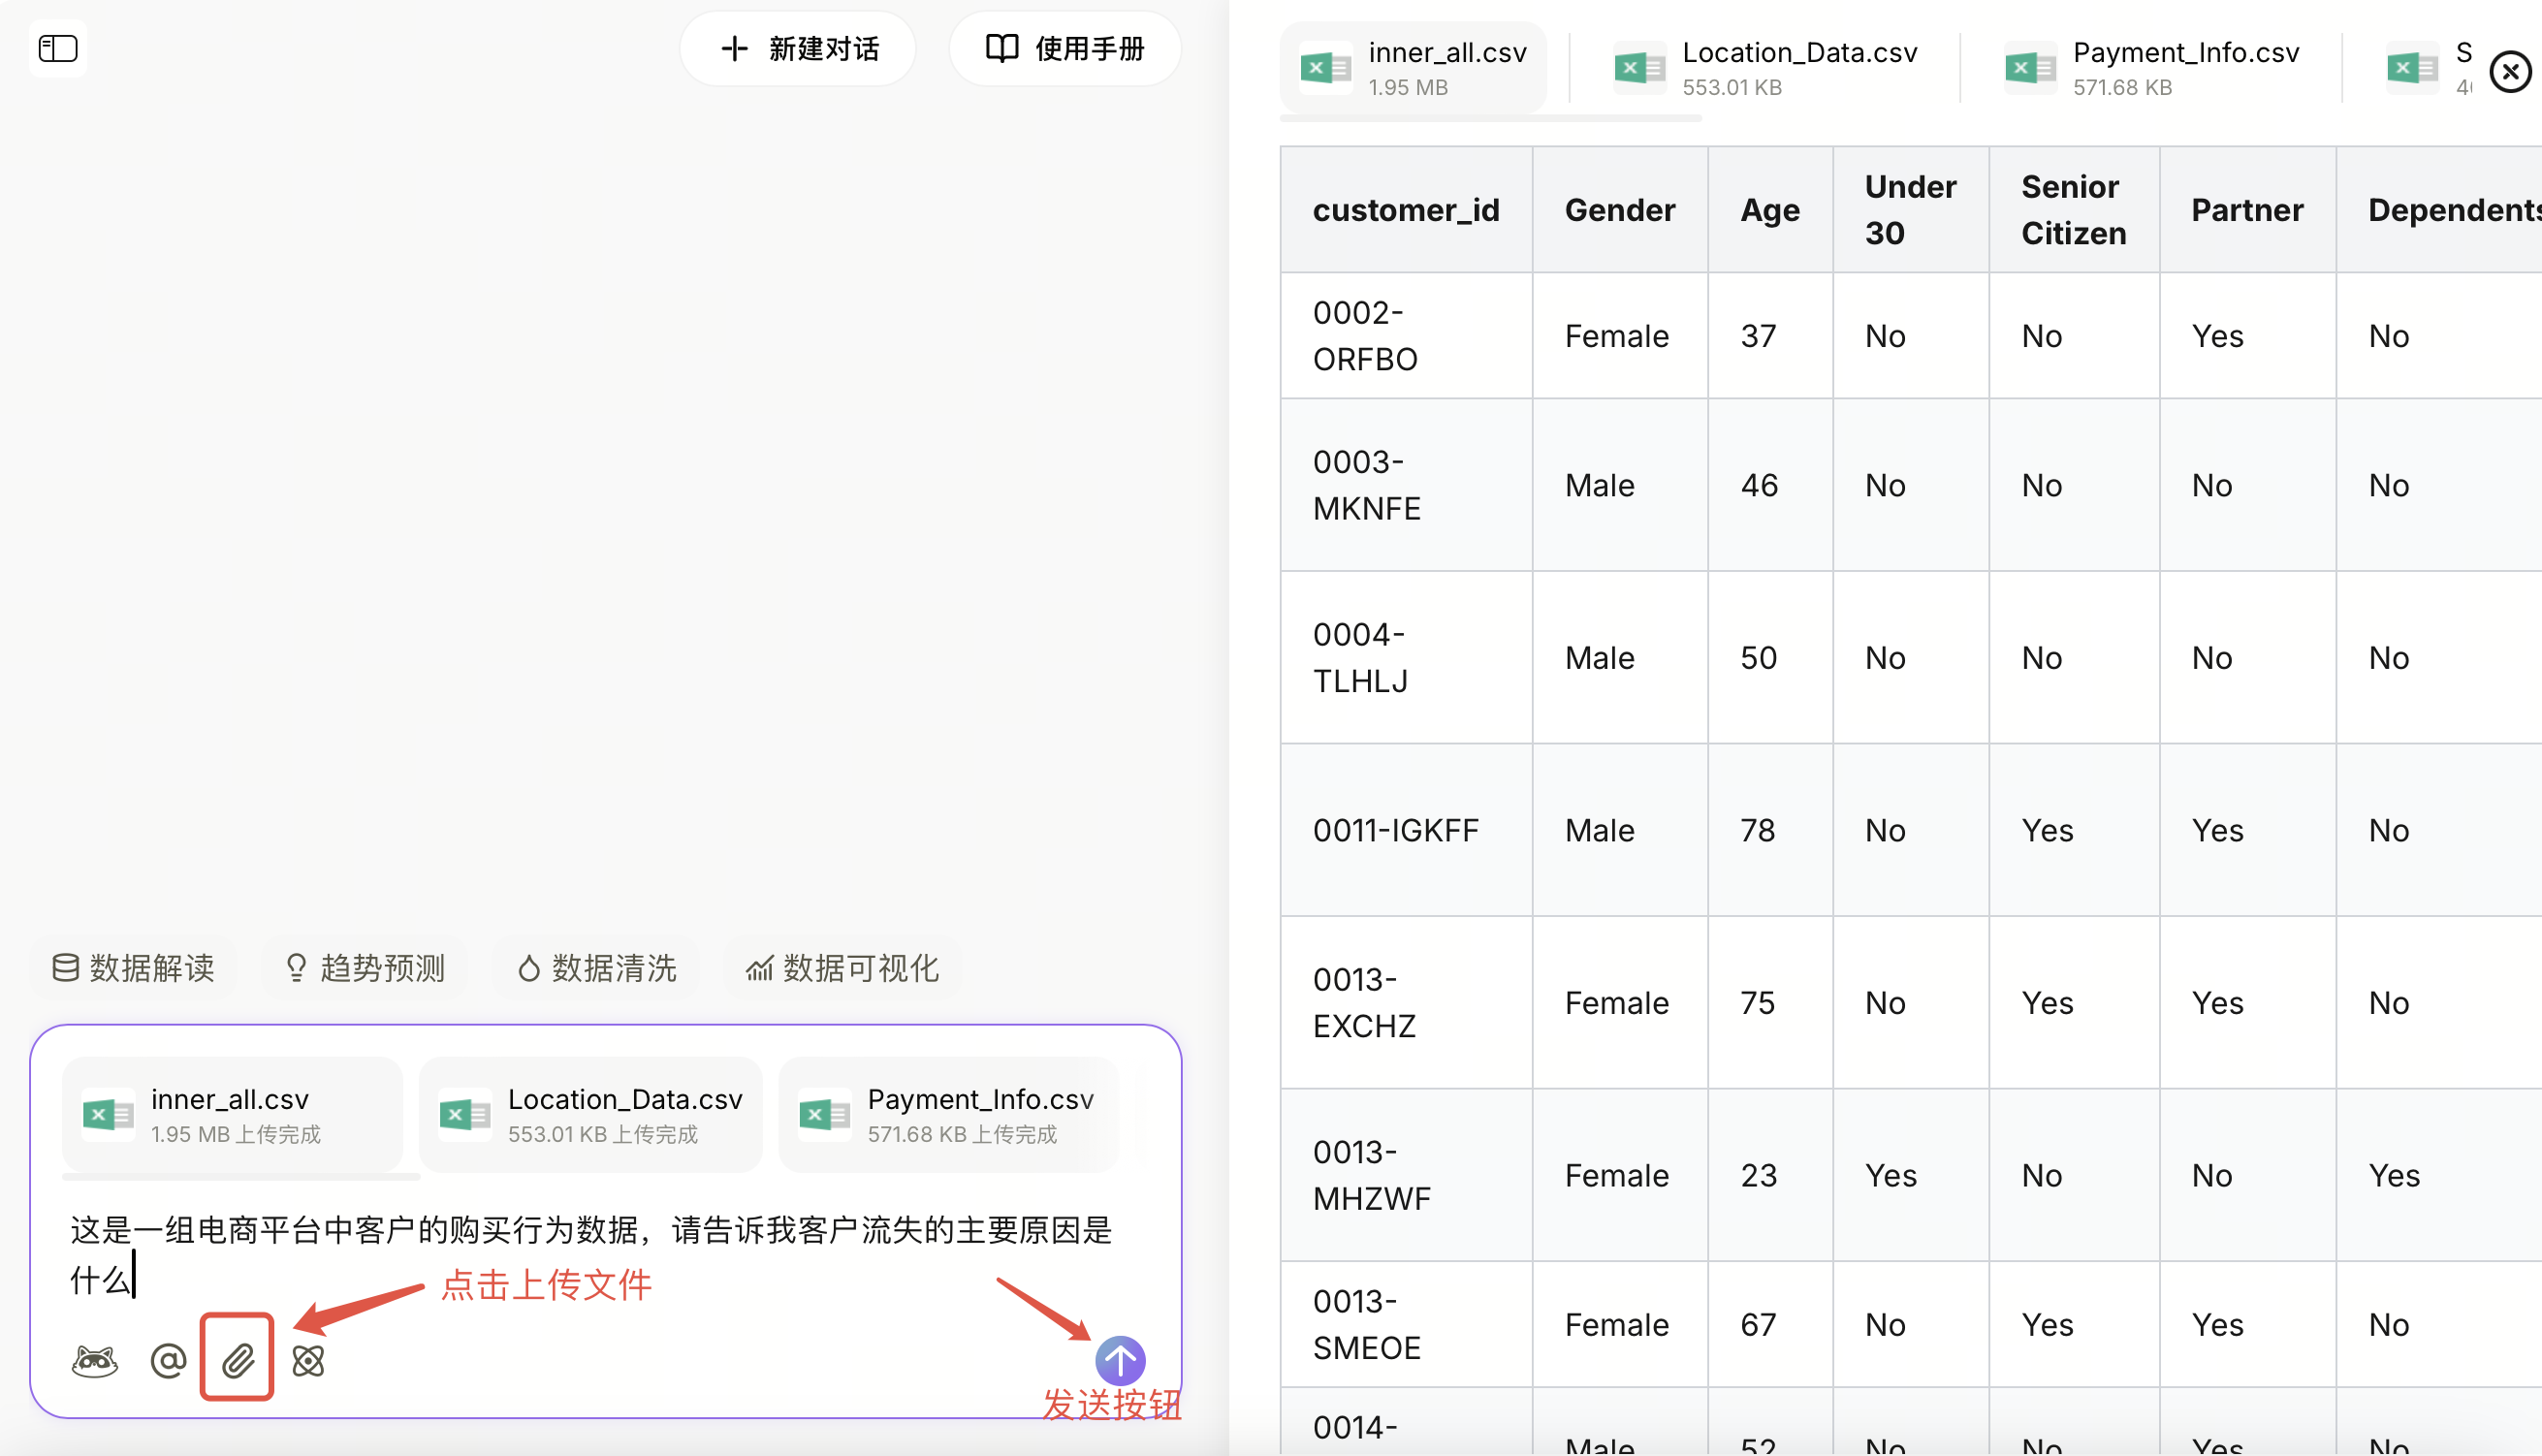
1. File Upload
You can upload files for analysis to Office Raccoon using the file upload feature.
Step 1 Drag and drop or click the upload button to select the file you want to upload. After a successful upload, you will be taken to the file preview.
Step 2 Enter your prompt in the chat box and click the send button to start the analysis.
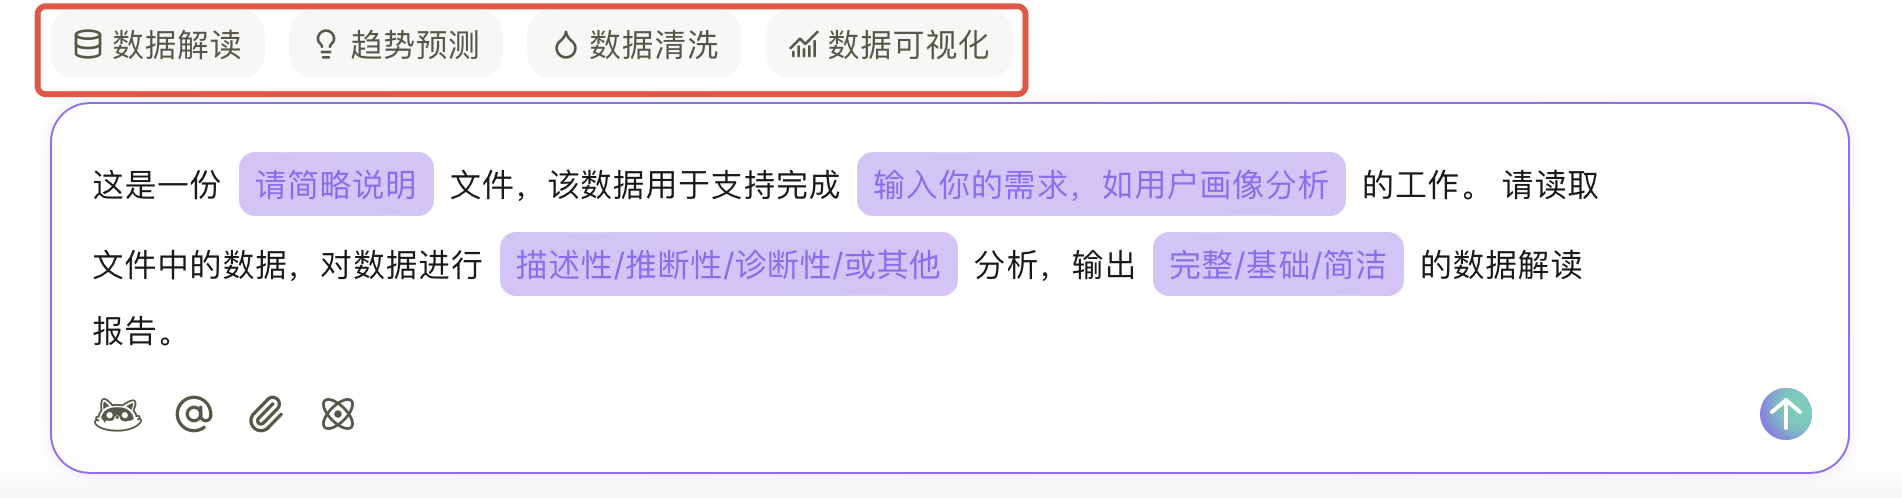
2. Prompt Templates
Click the Quick Tags above the chat box to bring up template content, which you can then customize.
3. Personalization
Click the logo below the chat box to open the personalization window, where you can customize the AI persona.

3.1 Custom Persona
The Personalization feature helps you flexibly adjust Office Raccoon AI's conversation style and generation preferences to suit your personal usage habits. You can find the "Personalization" entry point in the chat box. By creating and enabling different persona instructions, you can make the AI maintain a specific tone, identity, or task objective throughout the conversation, resulting in a more tailored interaction experience.
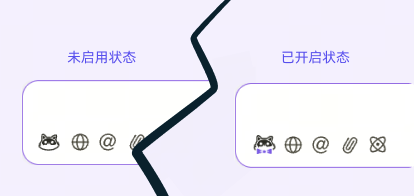
Step 1
Click Create Instruction.
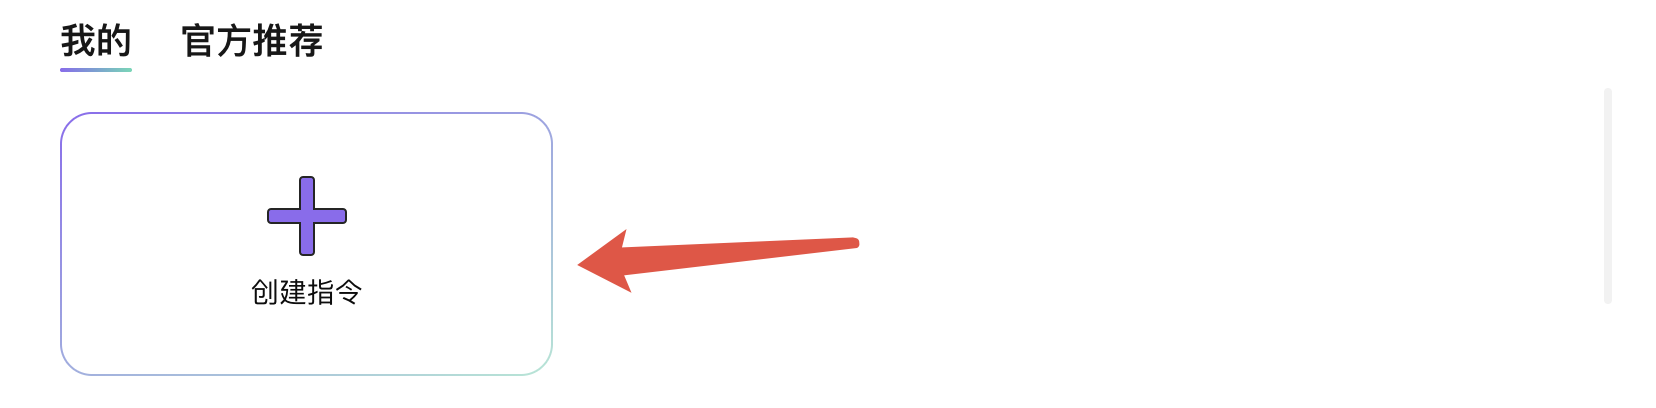
Step 2
Enter the instruction name and prompt, then click save to create it successfully.
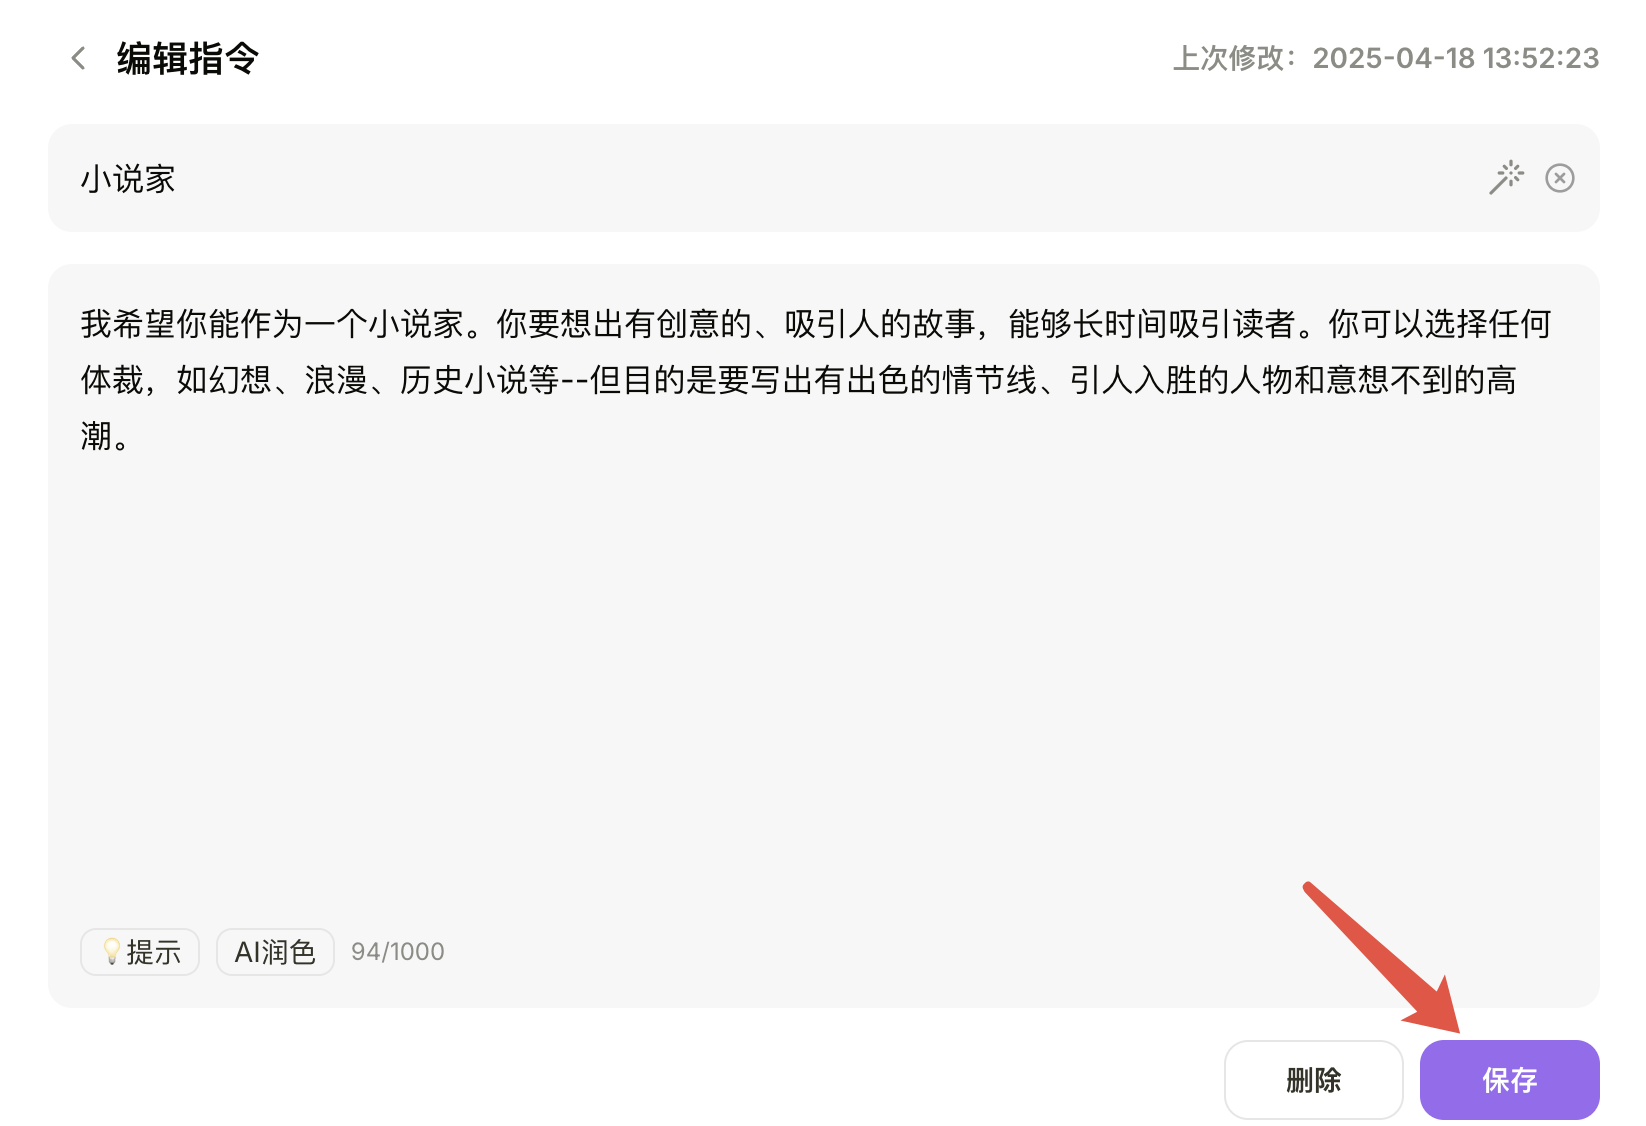
Step 3
Return to the "My List" tab to view all your instructions. Click Use and then Save to apply the instruction in the current conversation. The status will show as "In Use". Click "In Use" again to deactivate it. You can click on an instruction card to go to its details page to edit or delete it.
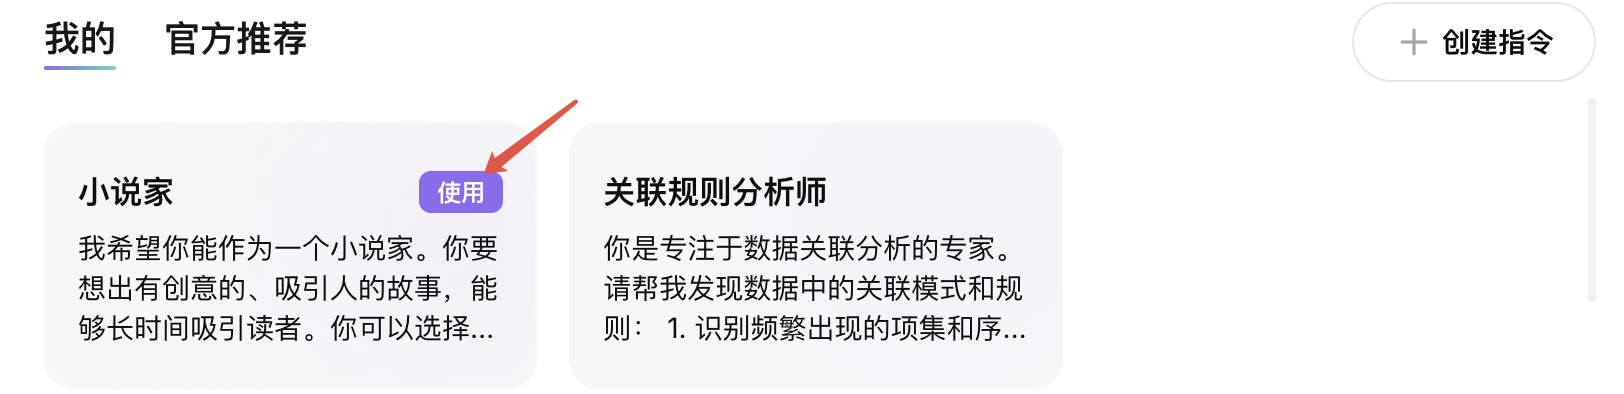
3.2 Official Recommendations
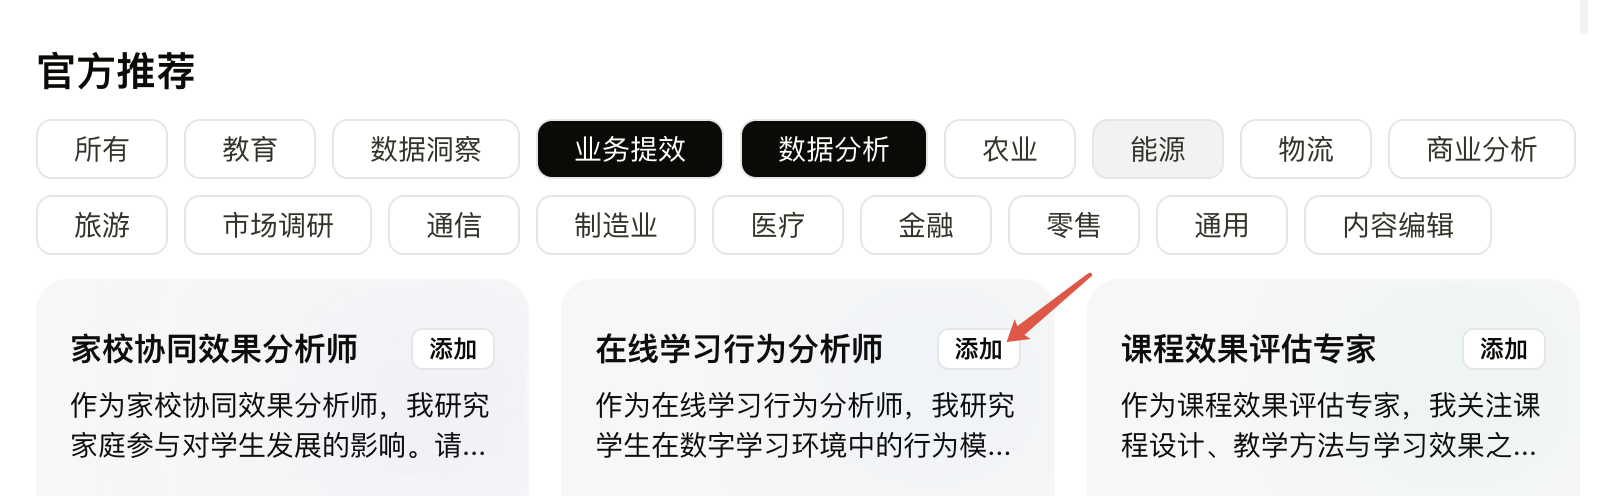
You can select a suitable recommended instruction to use in the current conversation. Once enabled, this persona will remain active for the duration of the conversation.
Step 1
Choose an official recommendation and add it to your list.
Step 2
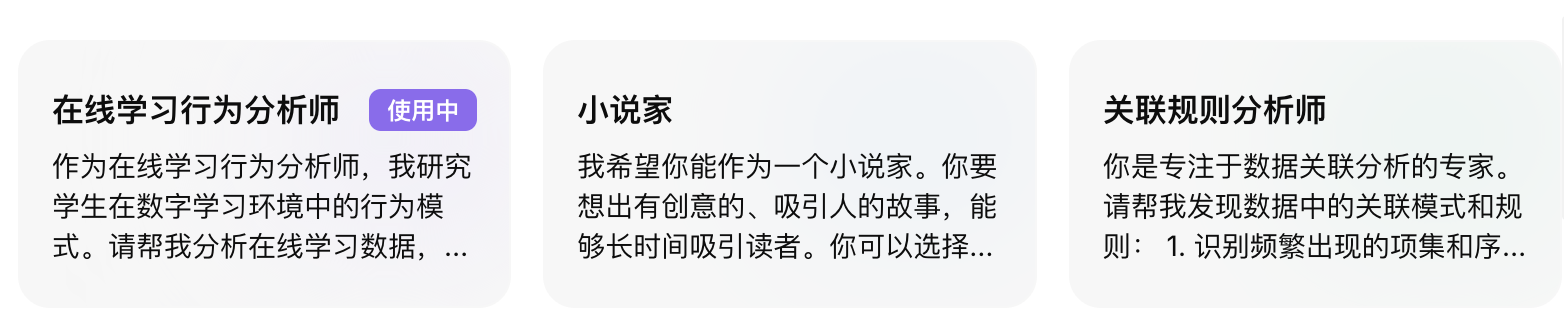
Return to the "My List" tab to view all your instructions. Click Use and then Save to apply the instruction in the current conversation. The status will show as "In Use". Click "In Use" again to deactivate it. You can click on an instruction card to go to its details page to edit or delete it.
3.3 Enable in New Chats
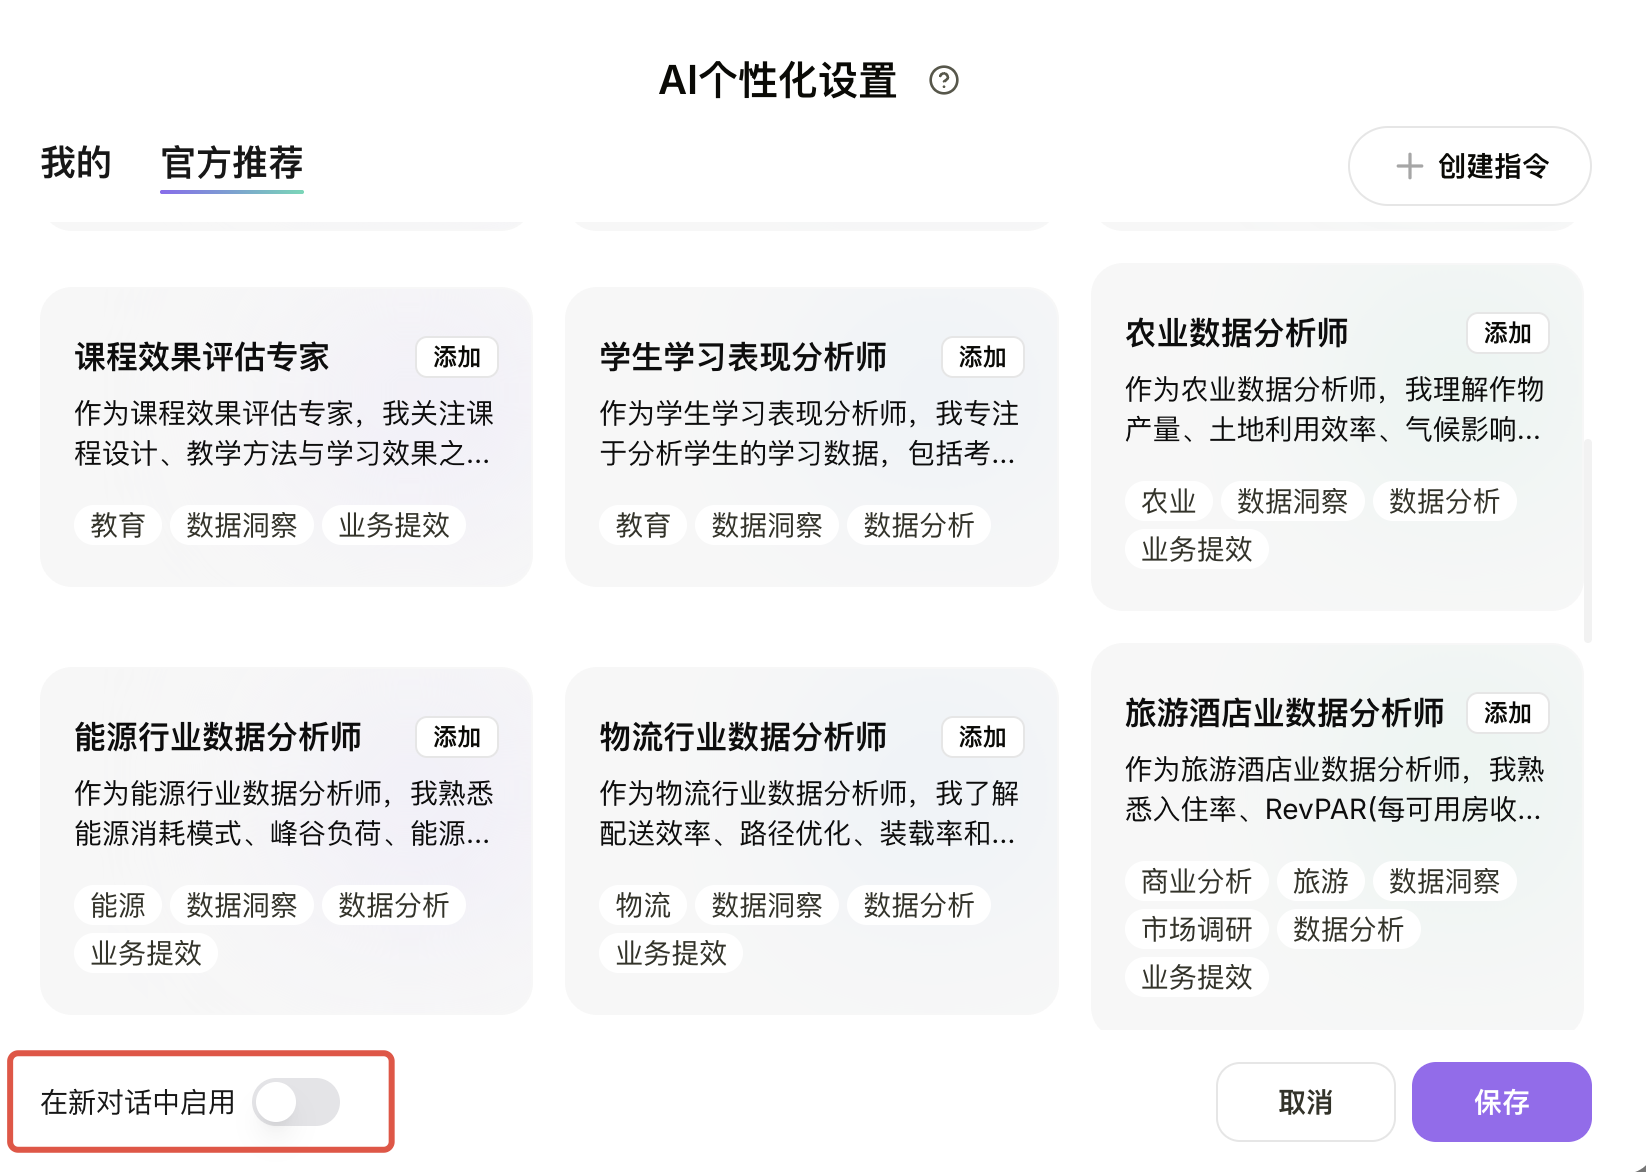
When the Enable in New Chats feature is turned on, the currently used instruction will remain active when you start a new conversation.
4. Mention File
Files that have already been uploaded to the Knowledge Base can be mentioned directly in the chat. The file will be automatically referenced for analysis.

5. Deep Thinking
This toggle will appear if the model corresponding to your product version supports this capability.
When enabled, the AI will help you understand complex problems more efficiently and propose better solutions. It goes beyond just answering "what you asked" and tries to anticipate "what you might want to know" or "what problems you might encounter but haven't asked about yet".

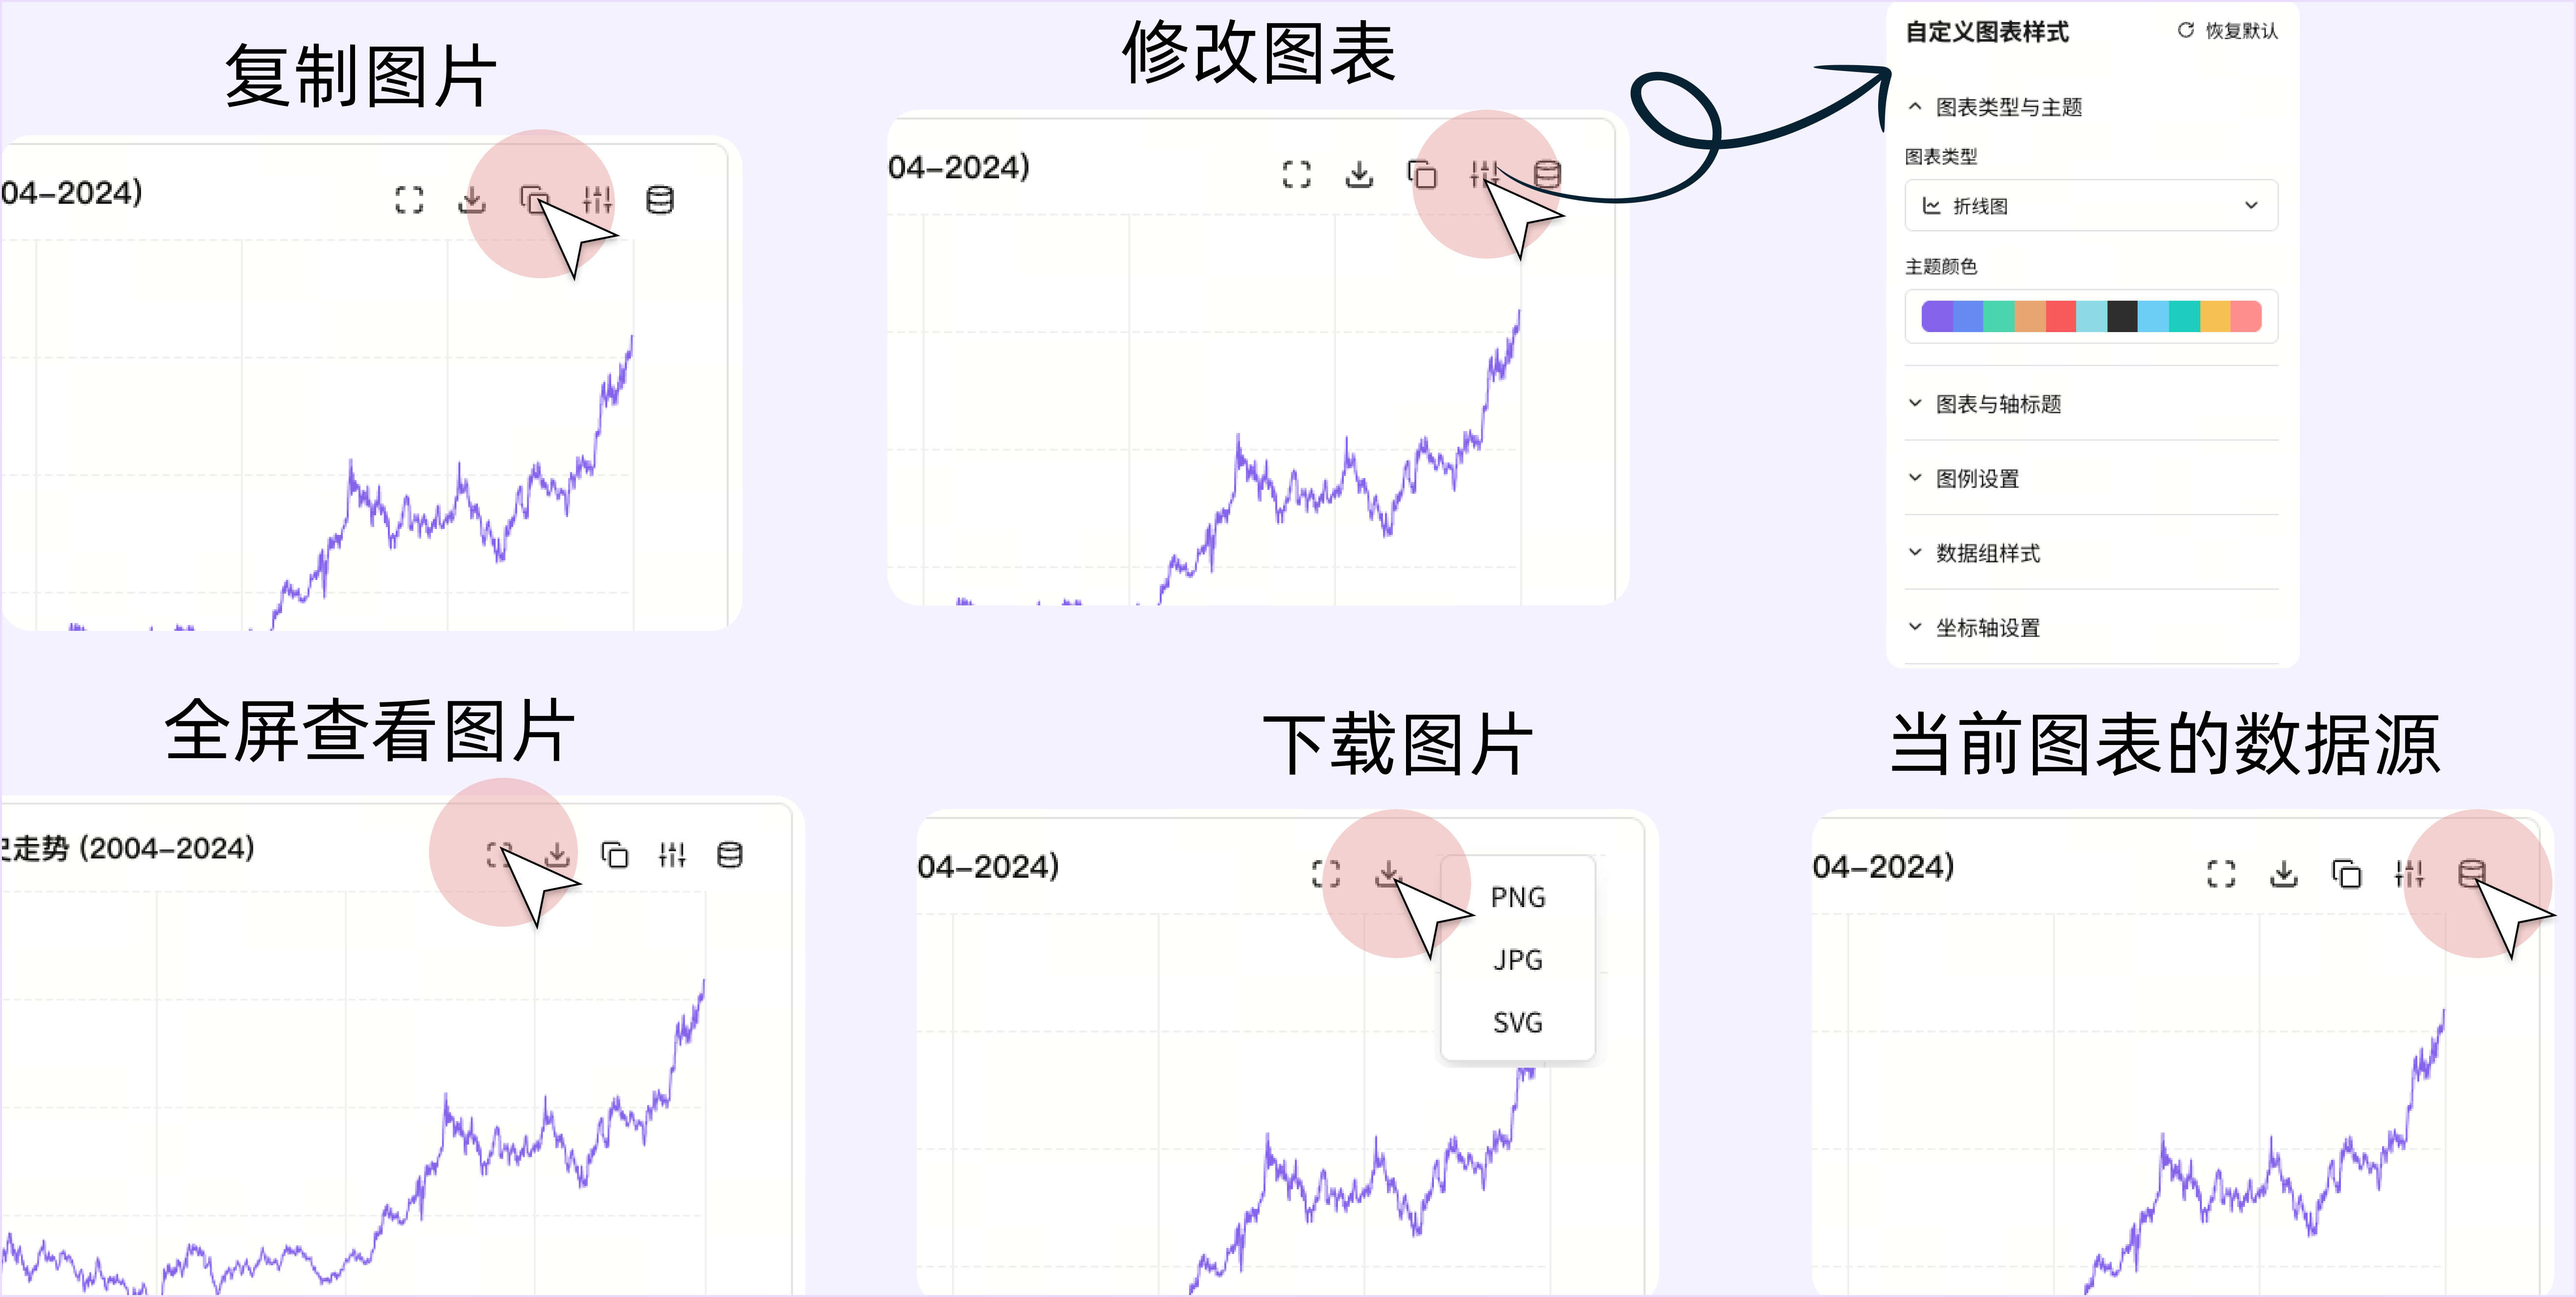
6. Interactive Charts
If your data analysis task generates a report with interactive charts, you can directly interact with the charts in the report panel on the right. Use convenient features like zooming, downloading, copying the chart (as a screenshot), and editing chart styles and data.
How to Enable: Go to
Settings > Feature Settings > Enable Interactive Charts. Once enabled, charts generated during the analysis process will automatically be converted into interactive charts.Feature Description:
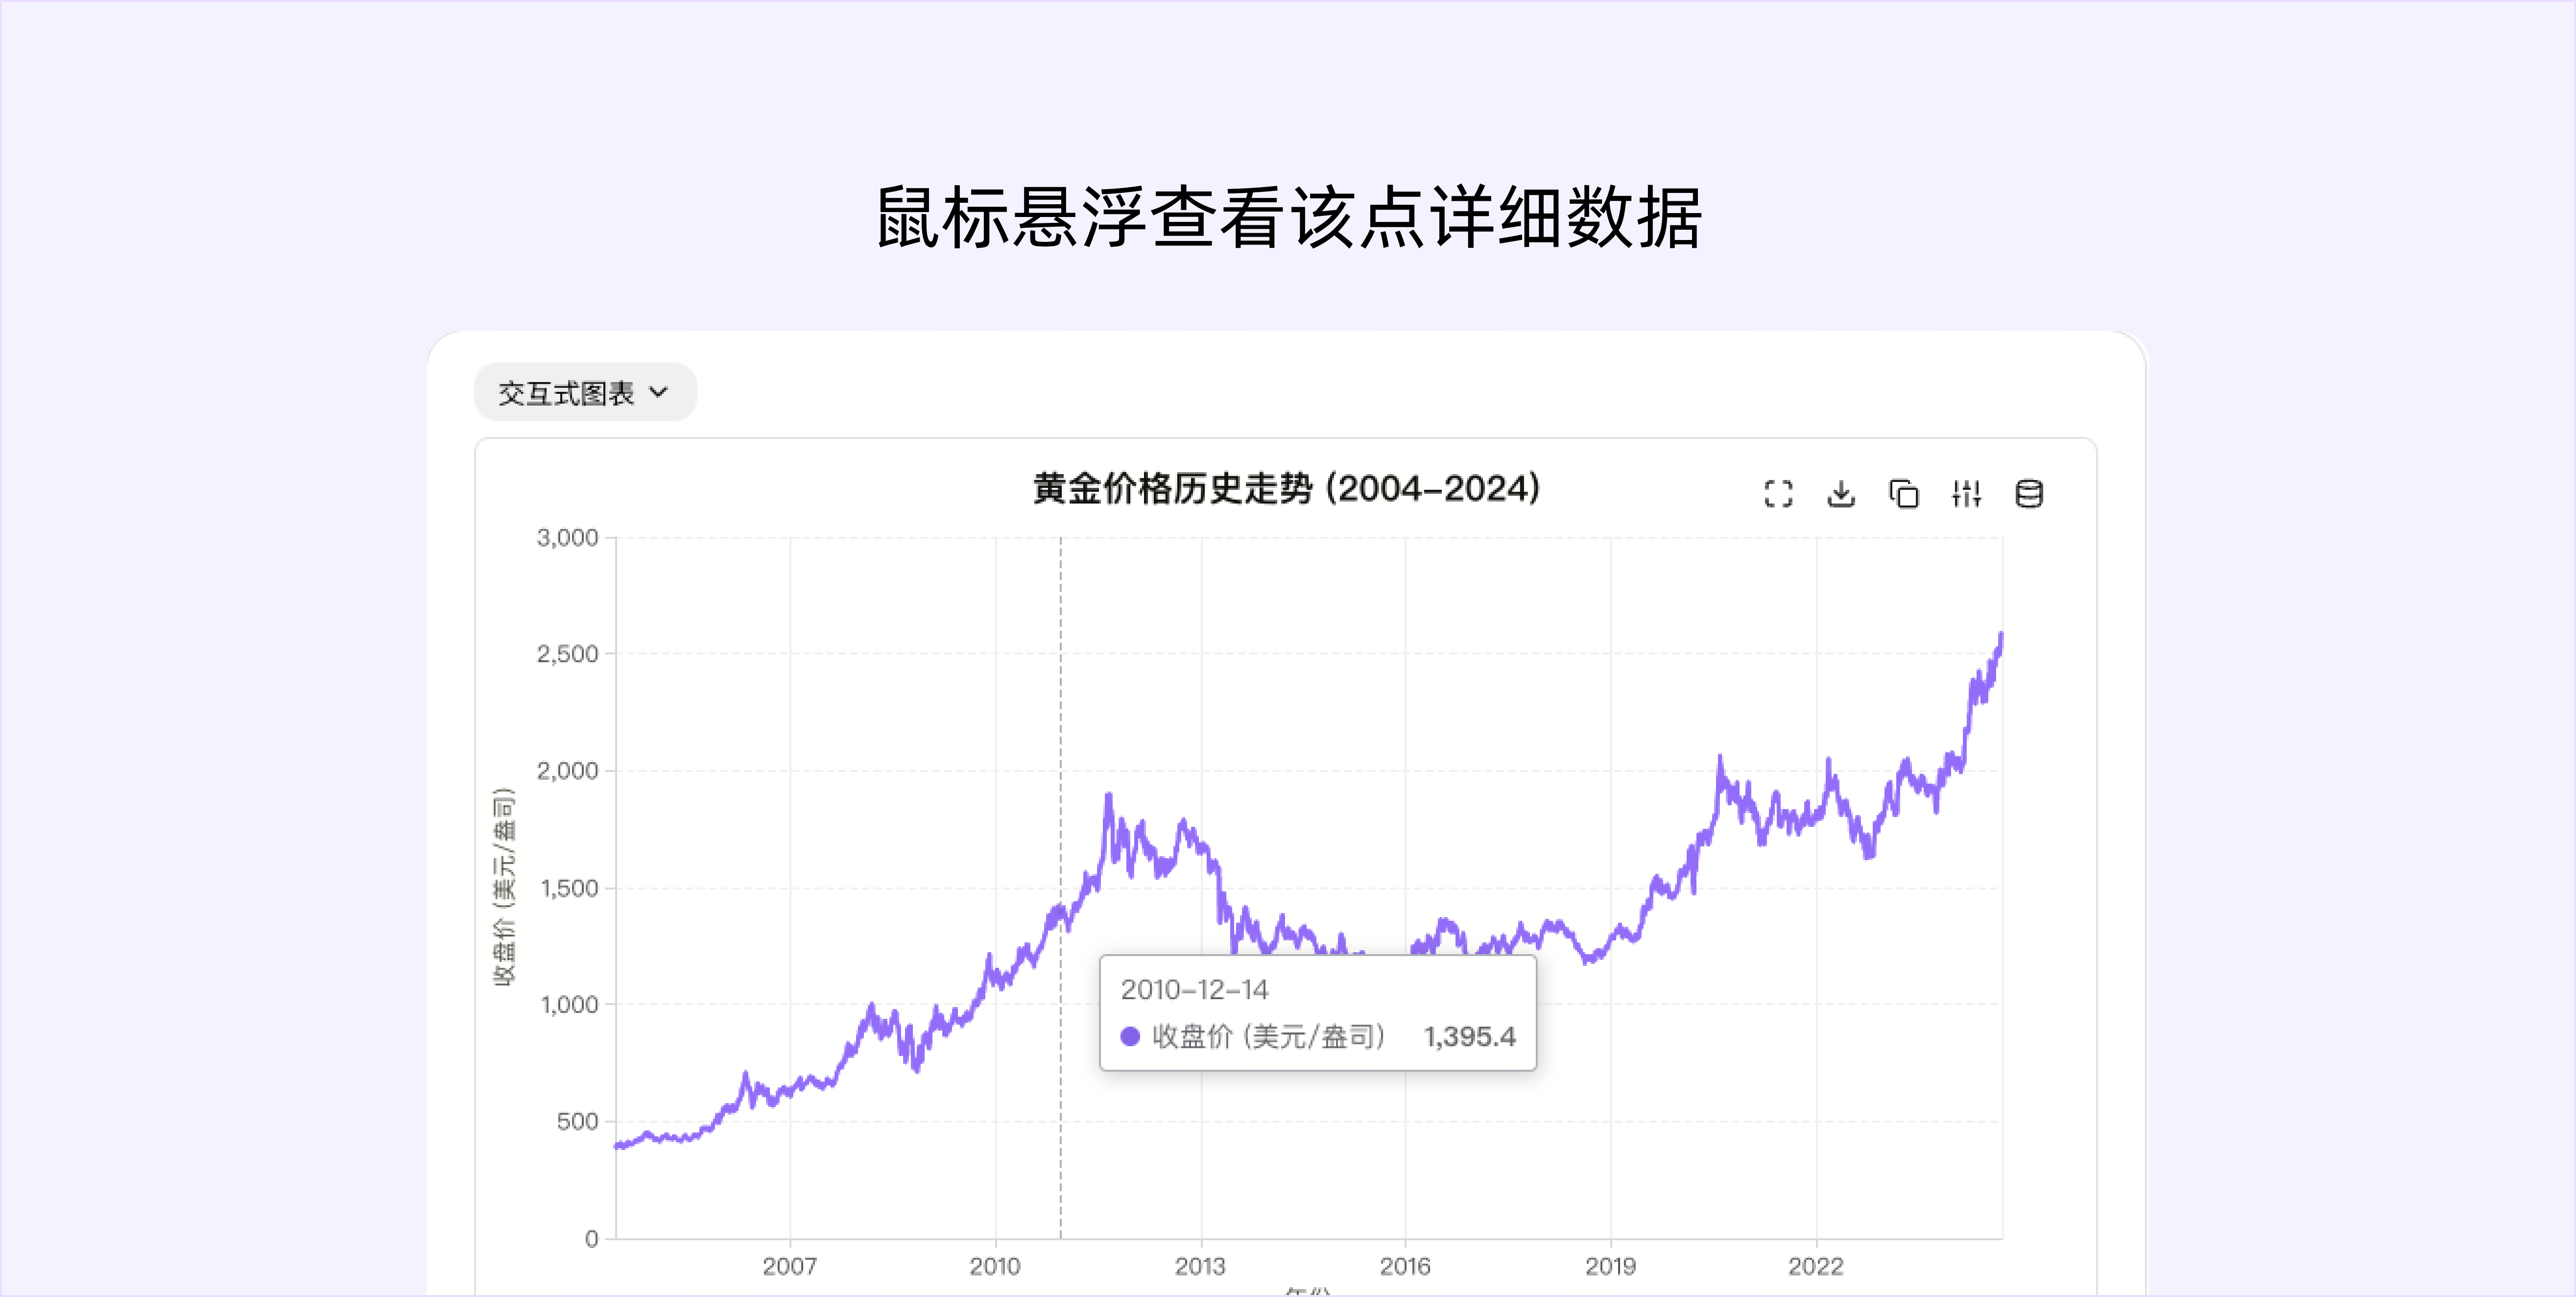
Tooltip on Hover: When you move your mouse over a data point on the chart, the system will automatically display detailed data for that point, including information such as value, time, and category.
Style Customization: You can customize the style of your charts, including colors, fonts, titles, font sizes, legends, axes, and more.
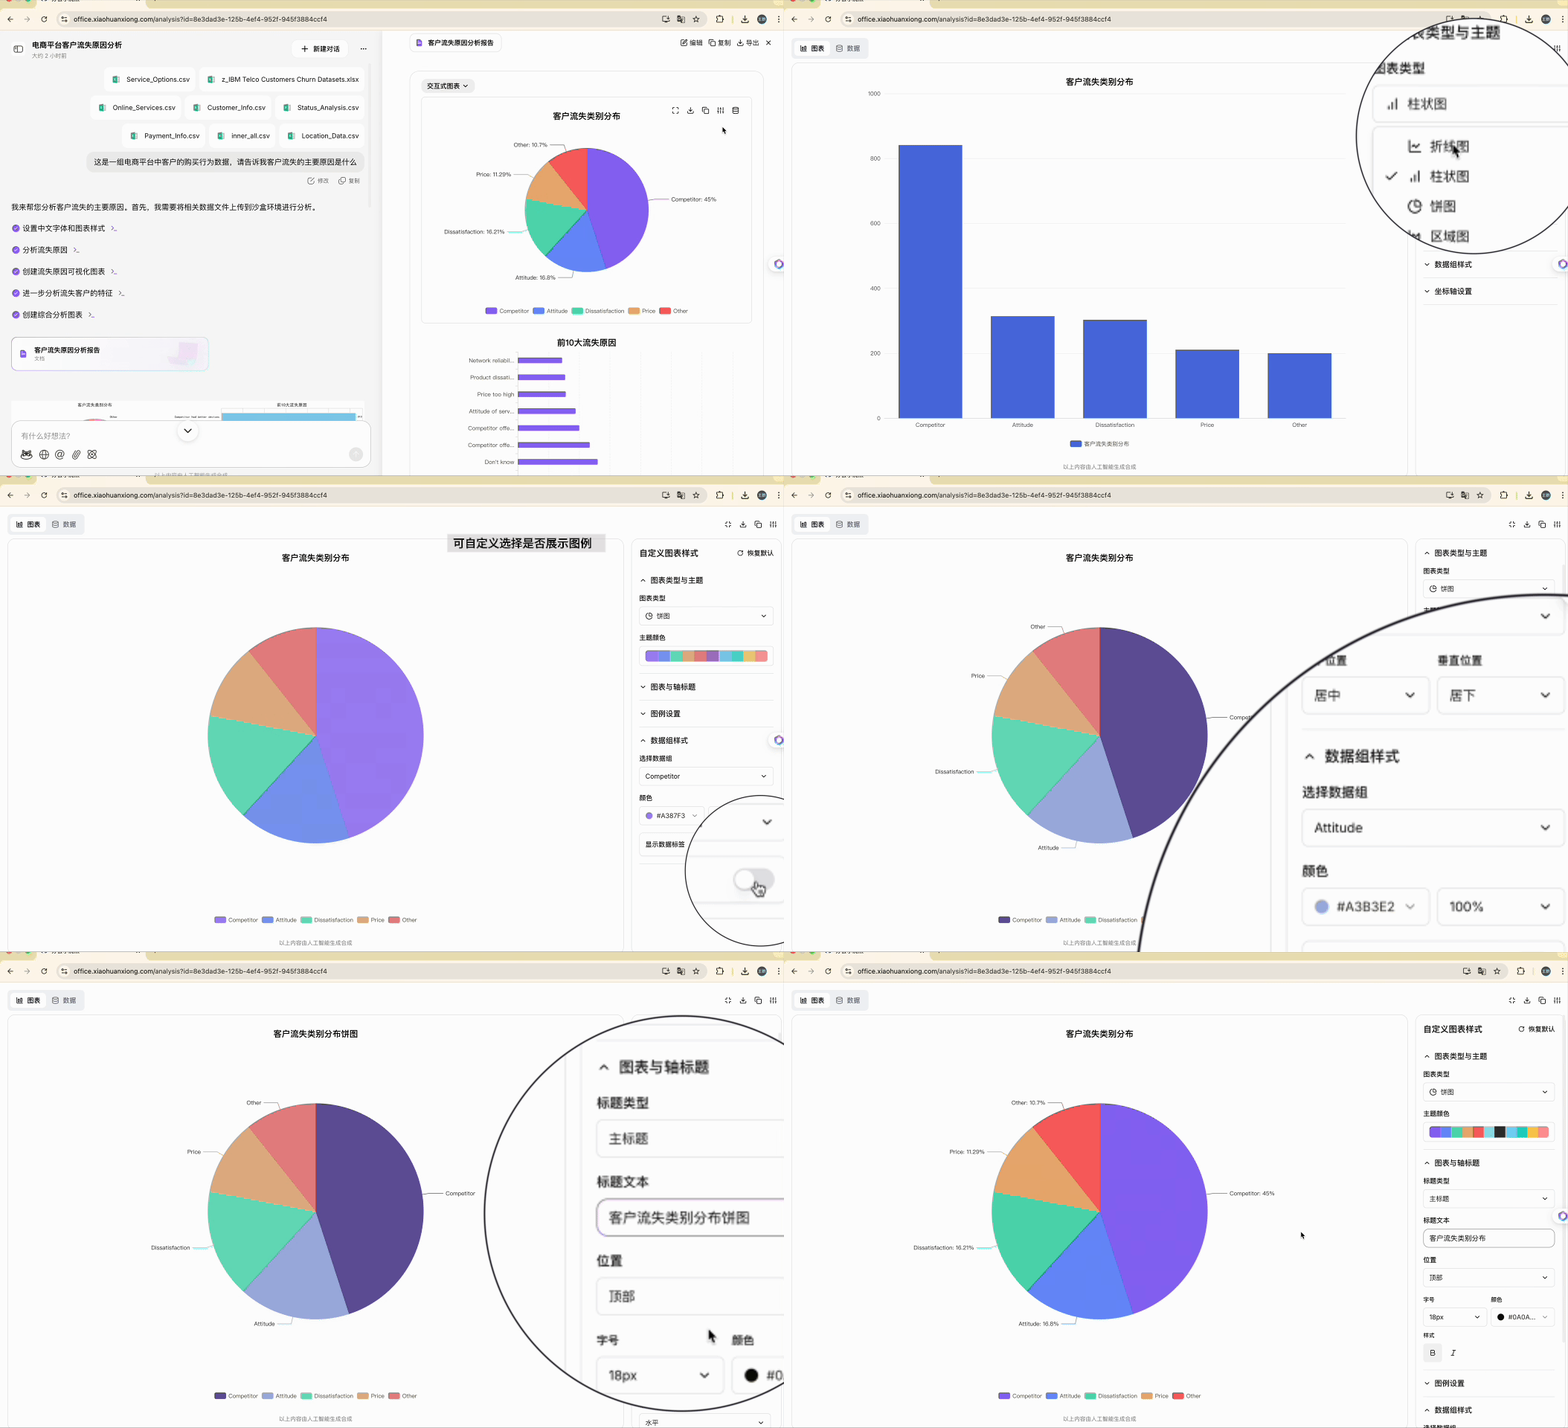
Export Function: You can export charts as PNG, JPG, or SVG files with a single click. You can also directly export the chart's data source as a CSV file, making it convenient for further data analysis.