Interactive Charts
Office Raccoon offers a wide range of interactive chart features to help you analyze and present data more intuitively.
How to Enable: Go to
Settings > Feature Settings > Enable Interactive Charts. Once enabled, charts generated during the analysis process will automatically be converted into interactive charts.Feature Description:
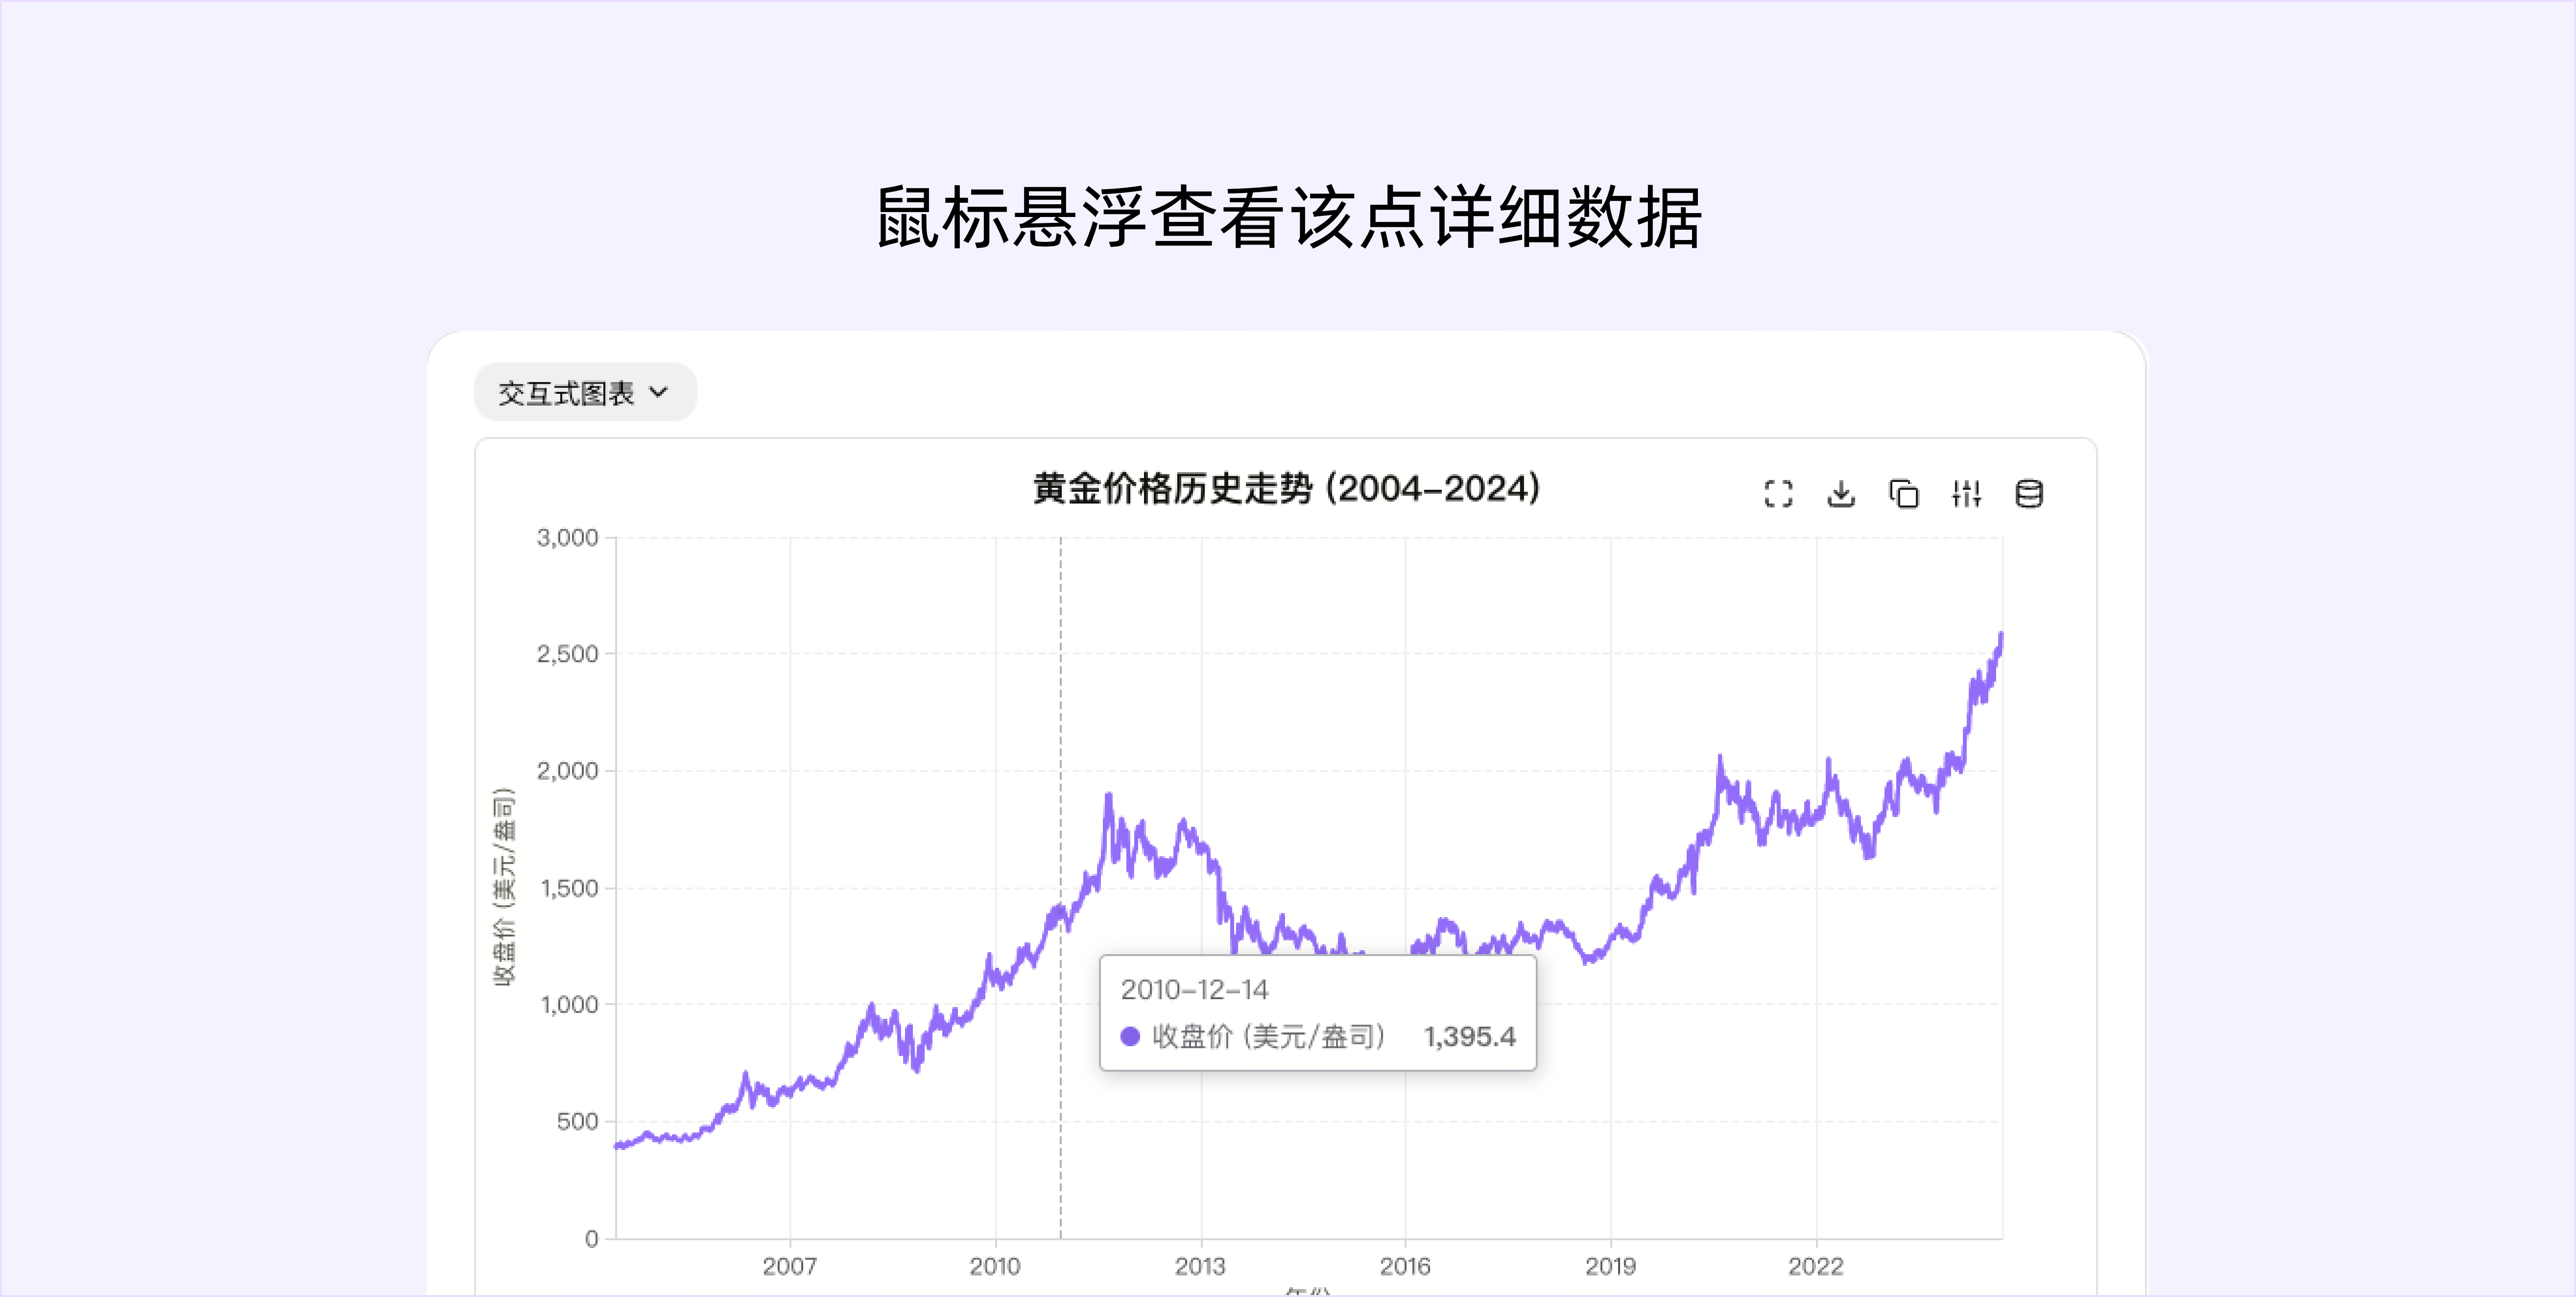
Tooltip on Hover: When you move your mouse over a data point on the chart, the system will automatically display detailed data for that point, including information such as value, time, and category.
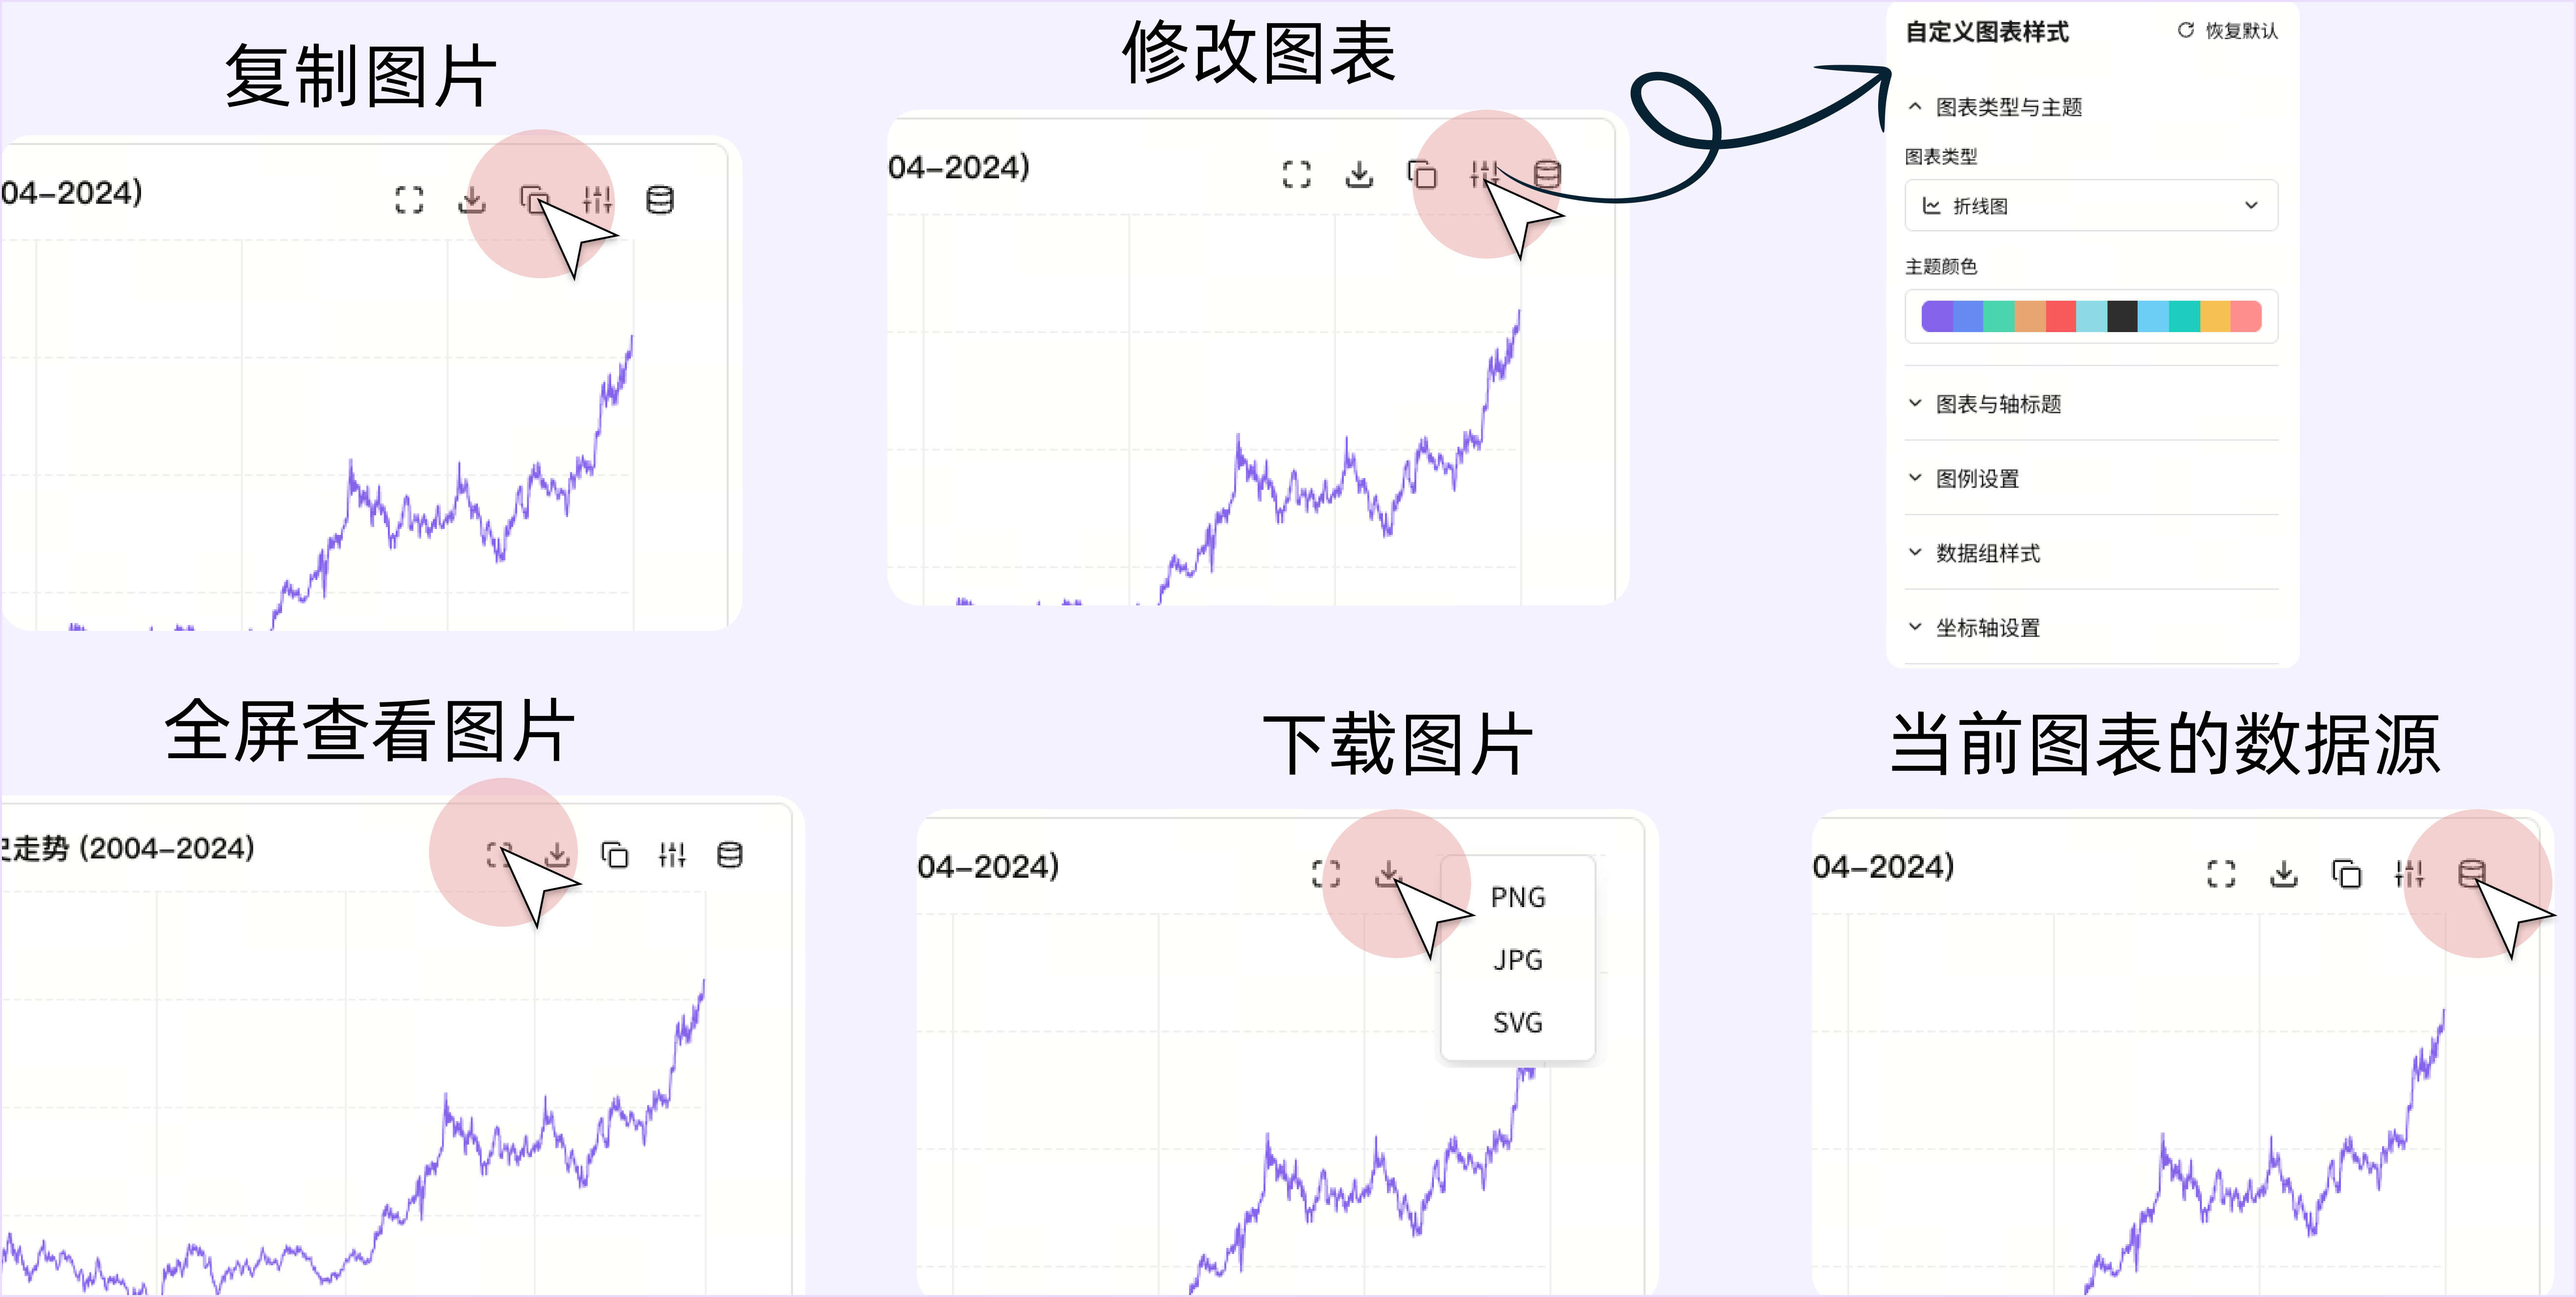
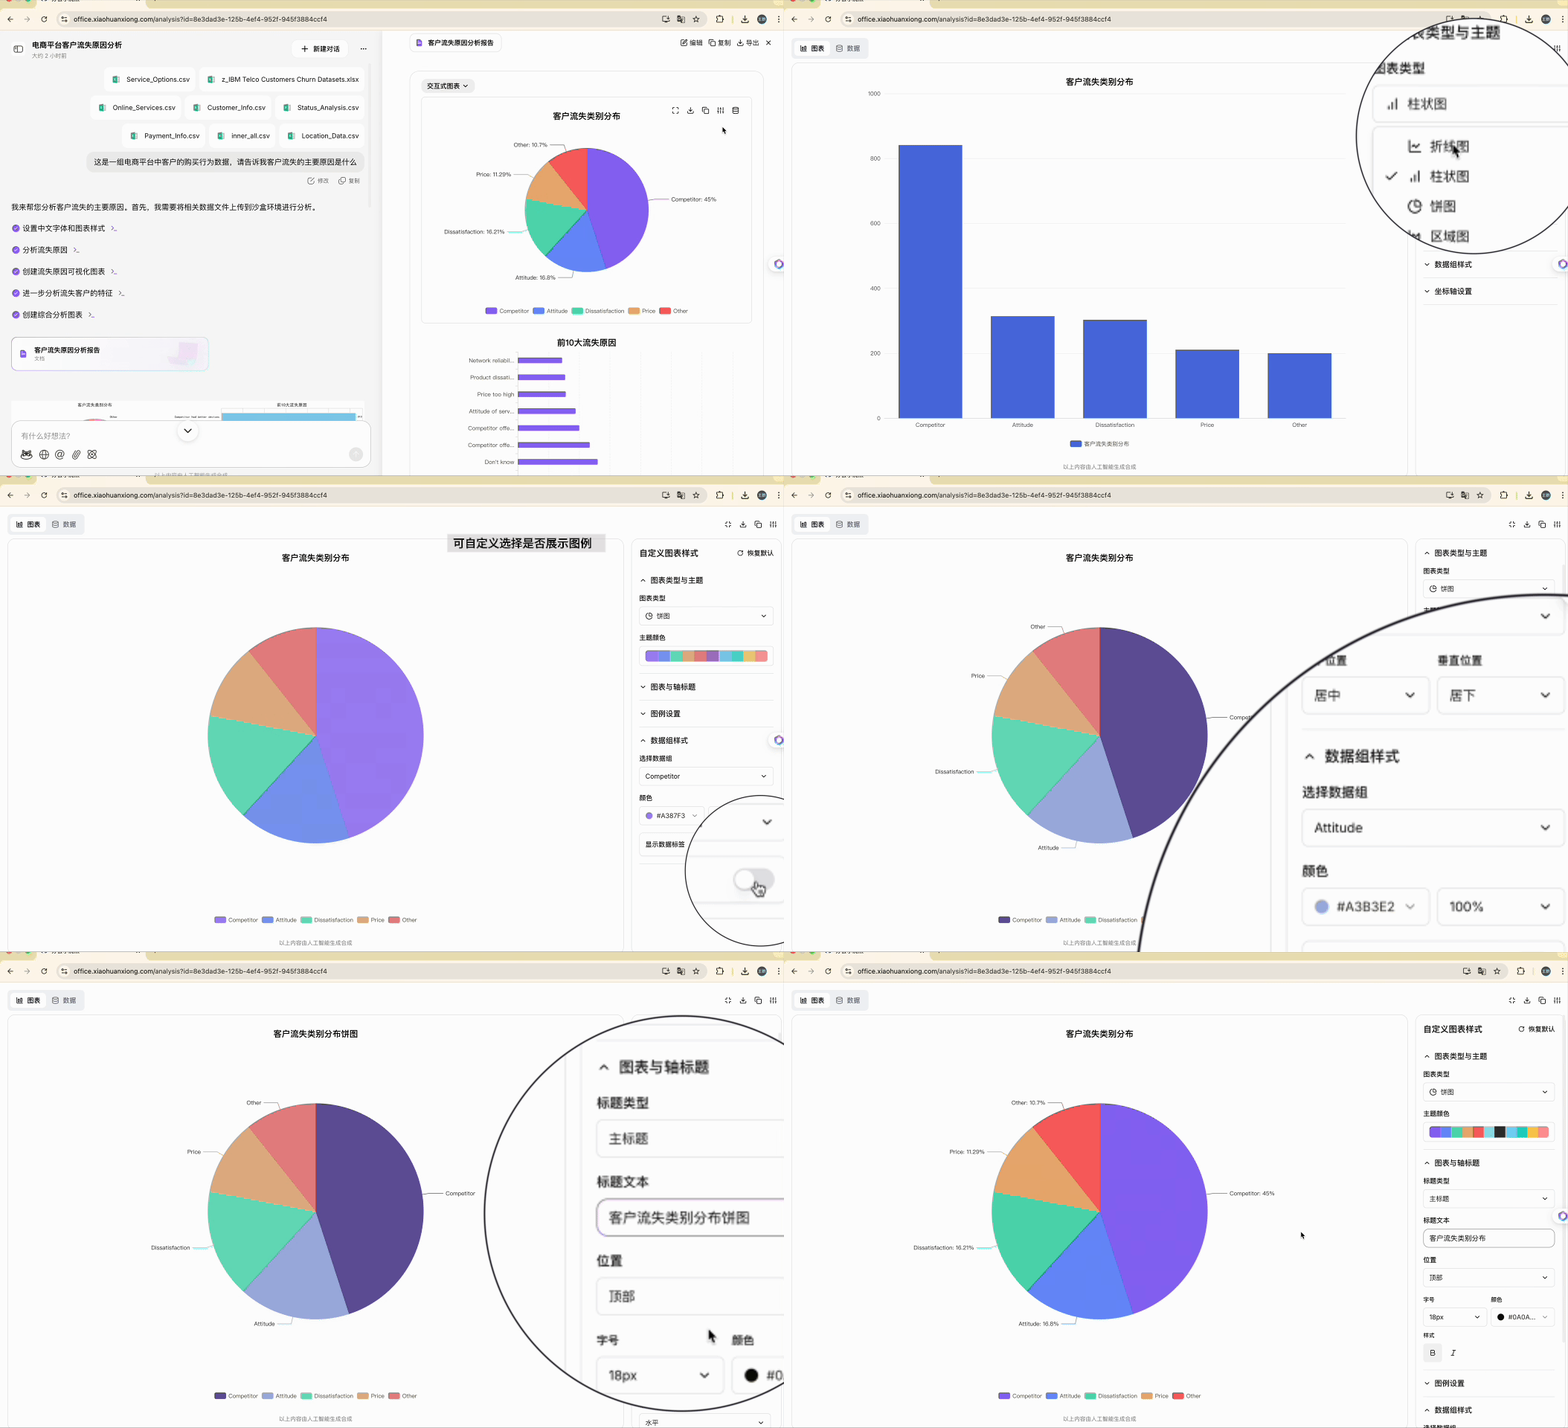
Style Customization: You can customize the style of your charts, including colors, fonts, titles, font sizes, legends, axes, and more.
Export Function: You can export charts as PNG, JPG, or SVG files with a single click. You can also directly export the chart's data source as a CSV file, making it convenient for further data analysis.